
China Cost Optimization 2026 - Balancing competitiveness in a shifting landscape
The rules of competition in China have changed. Most foreign companies have not.
For two decades, international companies operated in China under one assumption: Chinese manufacturers compete on price, and foreign brands compete on quality. That assumption is no longer valid. Chinese companies have graduated in technology, engineering depth, supply chain integration, and speed-to-market. The cost gap that once protected foreign margins is narrowing fast. In some sectors, it has already reversed.
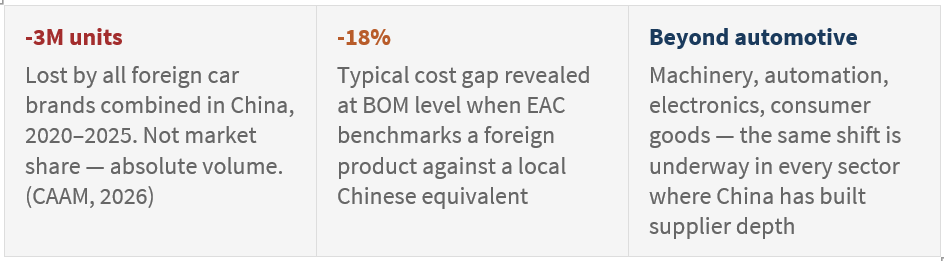
The Chinese car market added 10 million units between 2020 and 2025, growing from 20 to 30 million. Foreign brands did not participate in that growth; they declined from 12.4M to 9.4M units in absolute terms. Chinese OEMs took every incremental unit. The competitive shift is not a forecast. It is a five-year documented reality.
"Most foreign companies know they are more expensive. Very few know exactly where, why, and whether the customer even values the difference. That gap in understanding is where margin is lost."
Most foreign companies know they are more expensive than their Chinese competitors. Very few know where they are more expensive, why, and critically whether the customer values the difference. That distinction is everything. A product can be technically superior and commercially misaligned simultaneously.
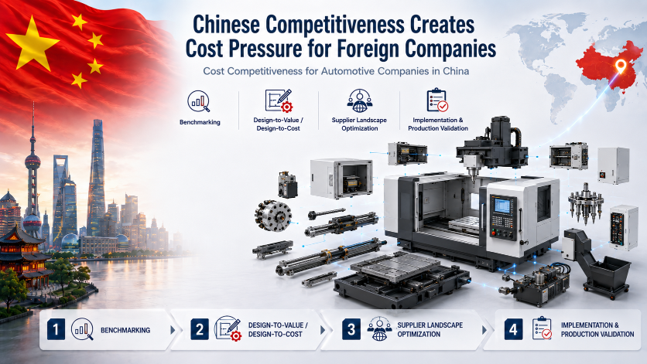
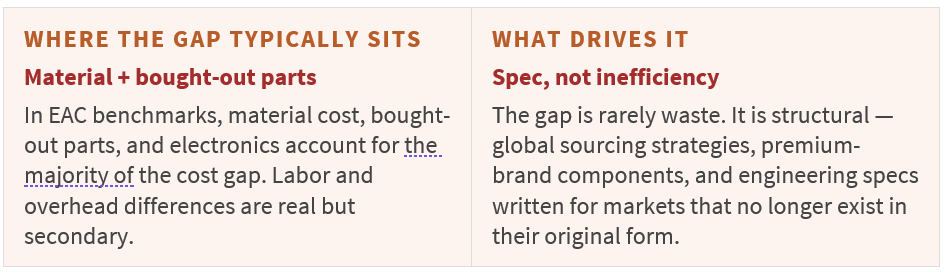
Expensive legacy specifications, over-engineered tolerances, global supplier premiums, and imported components that local supply chains can now match - these are the sources of the gap. They are identifiable. They are addressable. EAC's 4-step approach converts this from a diagnosis into a savings programme.
The 4-step approach: from cost gap to verified savings
Each step answers one specific question and builds the conditions for the next.
|
1 |
Where exactly are we more expensive and does the customer value the difference? Benchmarking goes beyond purchase-price comparison. EAC conducts BOM-level teardowns, feature-by-feature performance comparisons, and overhead and logistics analysis. The output is a cost gap map not a general observation, but a line-item fact base that drives decisions. Output: Cost gap map by BOM category and cost driver |
|
2 |
Which specifications create value and which are expensive legacy? Design-to-Value is not cost-cutting. It is the discipline of separating must-have requirements from costly complexity that no longer creates sufficient customer value. In China, where electrification, speed, and price-performance expectations are shifting fast, this question is urgent and non-trivial. Output: Prioritised action portfolio spec changes, localization, simplification |
|
3 |
Which suppliers can deliver the required quality at competitive cost? Once specifications are clarified, localized supplier options open up. Parts that previously required global or premium suppliers can often be resourced within China's deep ecosystem — at 30–45% lower landed cost. EAC manages the full process: spend analysis, RFQ, technical feasibility, supplier audits, TCO comparison, and savings tracking. Output: Qualified supplier shortlist, savings locked to P&L |
|
4 |
How do we ensure savings materialize in serial production, not just on paper? This is where most cost programmes fail. Savings are identified, approved, and then lost in implementation — through unclear ownership, tooling delays, supplier readiness gaps, or missing financial tracking. EAC manages implementation as a formal project phase: ramp-up support, APQP/PPAP validation, and P&L sign-off before any new supplier enters production. Output: Validated savings, tracked against baseline, confirmed in P&L |
EAC has done this. Across sectors, across geographies, with measurable results.
Thirty years operating in Asia. More than 2,500 projects across growth markets. The cases below are not illustrative — they are recent, named outcomes from EAC engagements. The methodology is the same across industries. What differs is the entry point, the dominant cost driver, and the competitive benchmark used.
|
AUTOMOTIVE — EUROPEAN SUPPLIER Material price reduction across 5 component categories ~5 mio EUR savings potential PVO of ~20 mio EUR. 20+ suppliers assessed across iron casting, alu casting, SMF, rubber & plastic, and special components. → 5 categories benchmarked against 20+ qualified suppliers → Global sourcing activities upgraded as direct outcome |
MACHINERY — GERMAN MACHINE BUILDER New machine concept for Chinese market customers 30% landed cost reduction Design-to-Value led. Mid-tech market segmented across premium, mid, and low tiers. Customer clinic to define technical parameters. → Best-practice Chinese players benchmarked on technology and cost → New concept validated against 30% savings target |
|
CONSUMER GOODS — FOREIGN COMPANY Multi-country footprint and cost analysis Decision-ready footprint data 10-country analysis for the Chinese plant. RFQ across SEA. Supplier audits with cost breakdowns. Plant continuation decision supported. → Sample products selected for cost reduction across supplier base → Audit-based cost breakdown across all selected suppliers |
SCM OPTIMIZATION — EAC CHINA CASE New supplier development and qualification CNY 20 mio annual savings 22 new suppliers developed. 64 qualified samples delivered. ~12% of procurement spending recovered through structured SCM optimization. → Commercial sourcing integrated with technical validation → Savings locked to P&L before serial production entry |
TALK TO THE EXPERTS
|
Partner, EAC Shanghai |
Partner, EAC Shanghai |
Partner, EAC Munich |
|
The cost gap is not going to close on its own. But it is also not as opaque as it feels. Thirty years across Asia has taught us one thing consistently: the gap is always more specific than it looks and more addressable than it feels. We find it. We close it. |
EAC Munich | Shanghai | Mumbai | Kuala Lumpur | New York
Latest
Why Hyper-Localization is the New Playbook for International Success in China

China Cost Optimization 2026 – Balancing competitiveness in a shifting landscape

India’s Industrial Decarbonisation Shift: The Emerging Role of CCUS

ASEAN Investment Location Compass | 2026 Edition
